| GIS STORY |
| Ancient Roads |
| DUTCH VERSION |
| Main Contents |
Correlation between the spatial distribution of
Bronze Age circular structures, ancient roads and
soils in the study area Adegem (East-Flanders):
a GIS approach.
Correlatie tussen de ruimtelijke spreiding van
cirkelvormige structuren uit de bronstijd, oude wegen en
bodems in het studiegebied Adegem (Oost-Vlaanderen):
een GIS aanpak.
Ludo Fockedey, Carole Ampe, Roger Langohr
Gent University, Laboratory of Soil Science
Krijgslaan 281, S8, B-9000-Gent
[email protected]
| © 2004 - Ludo Fockedey, Carole Ampe, Roger Langohr This website contains copyrighted material. No part of this document may be reproduced, stored in a database or retrieval system, or published in any form or way, electronically, mechanically, by print, photocopy, microfilm or any other means without prior written permission from the authors. |
1. INTRODUCTION
Between 1993 and 1995, an interdisciplinary project involving archaeology and pedology research units, mapped and investigated the distribution of circular structures detected by aerial photography and its correlation with the Soil Map of Belgium. The results were published in 3 volumes (Ampe et al., 1995; Bourgeois et al., 1998, 1999).
One of the conclusions was that, apart from the overall analysis of the localisation of the circular Bronze Age structures on the Belgian soil map, a detailed study of the distribution of the circular structures was needed to reveal possible secondary trends (Ampe et al., 1995, p 165). With this purpose, we studied the soilscape and landscape evolution in the Maldegem-Adegem area using historical and archaeological data (Fockedey, 2003).
This paper also aims to make a contribution towards the use of a GIS as a tool of spatial and statistical analysis on basis of ancient roads, circular structures and soils.
2. DATA AND METHODS
The ArcInfo program was used for digitising the analogue maps and the ArcView 3.1 was used for processing the data. The tabulated data were exported as a Dbase file into an Excel spreadsheet for statistical analysis.
The GIS-system incorporated the following spatial data that were available as or converted into a vector format.
- The Belgian soil map available in digital form (polygon), originally published on a scale 1:20 000 (Eeklo 24E, MGI, 1970; Maldegem 24W, MGI, 1961; Knesselare 39W, MGI, 1968; Zomergem, 39E, MGI, 1967).
- The contour lines (line), digitised from the analogue topographical map (NGI, 13/3-4, 1983; 13/7-8, 1984, scale 1:25 000).
- The distribution of the circular structures (point) imported from a database (Department of Archaeology, UGent) containing the coordinates according to the Lambert 72 projection.
- The ancient roads (line), digitised from the cadastral maps of Popp (scale 1:5 000).
3. PHYSIOGRAPHY
3.1 Relief
The relief is mainly flat to weakly undulating, going up from north
(5m) to south (5-15 m). In the west to southwest, a long cuesta hill (15-18m)
is present.
In order to study the macrotopography, the study area was divided into 4 relief
zones corresponding to a height interval of 5 m: zone 1 (< 5 m), zone 2 (5
- 10 m), zone 3 (10 - 15 m) and zone 4 (> 15 m).
3.2 Soilscape
The soil units in the Belgian soil classification system are defined by three soil characteristics: texture, drainage and profile development.
In the study area three main categories appear:
1. the soil units, characterized by texture, drainage and profile development
(93,34%)
2. non-differentiated soils (e.g. soils on peat) (0,11%)
3. artificial soils (built-up areas, raised areas and turned up areas) (6,55%)
Because of the huge amount of different soil units, a simplified textural map
was made from the digital soil map. On this map, two textural units can clearly
be distinguished:
- unit A, corresponding to a dominantly sandy (Z) area (83%)
- unit B, corresponding to a dominantly silty sandy (S) area (54%)
3.3 Combined relief and soil data
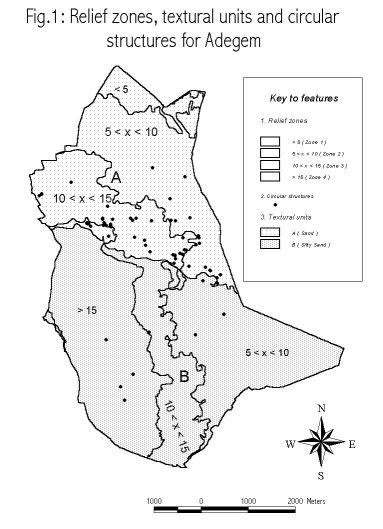
The combination of relief and soil maps (fig. 1) shows a clear discordance between both elements. The contour lines have a dominant north - south orientation whereas the textural boundary has a northwest - southeast orientation.
4. RESULTS
4.1 Relation between roads and circular structures
Old roads according to the literature
By using detailed information from land books up to 1640, most of the roads in the study area could be localised and named (Fockedey, 2003, pp. 71-80). Three of these roads were already considered to be old roads (Verstraete, 1949, pp. 49-57).
On the map (fig. 2) they are named as i) Herwech 1, ii) Herwech 2 and iii) (Ouden) Ghentwech.
Old roads according to GIS processing
The oldest road map that can be reconstructed in detail goes back to approximately 1640. Considering the distribution of the detected Bronze Age circular structures in the study area, it seems to be possible to select some of these old roads. This reinforces the idea that there is a correlation between some of these old roads and the funerary monuments. Two of the aspects that can be used further in this research are the nearest distance from a circular structure to a road and the number of circular structures that fulfil this condition of proximity.
Map interpretation
The above assumption was tested by using the ArcView extension GeoProcessing Wizard > Assign data by location > nearest.
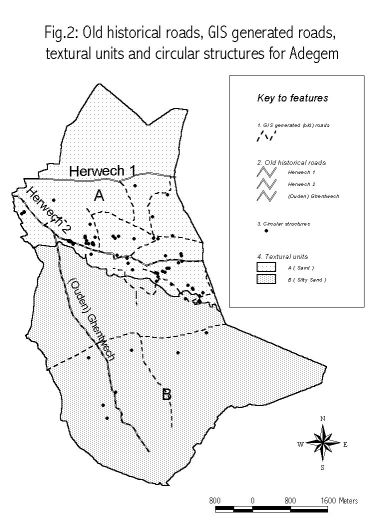
The new roadmap (fig. 2) differs from the map with the historical roads.
- The historical road Herwech 1 is absent. This road is nowadays the most important connection between Maldegem-Adegem-Eeklo and along its course, built-up areas are abundant. This interference could explain the absence of detected circular structures along the road.
- There is a clear difference in road pattern between units A and B. In unit A, corresponding to the sand ridge, the road pattern is capricious with no preferential orientation. In unit B, the roads have a dominant north-south or east-west orientation.
Statistical interpretation
Up to 1997, 68 circular structures could be traced in the study area.
Herwech 2 stands out as 44 % of the circular structures are related to this historical road. Together with roads 33 and 34, both connected to Herwech 2, this figure goes up to 68 % (table 1).
Table 1: Number of circles (%) related to the historical roads
|
Road # |
50 | 49 | 47 | 45 | 41 | 39 | 38 | 37 | 34 | 33 | 31 | 21 | 20 | 14 | 13 |
| % Circles | 44,1 | 1,5 | 4,4 | 4,4 | 1,5 | 5,9 | 2,9 | 1,5 | 11,8 | 11,8 | 1,5 | 1,5 | 1,5 | 4,4 | 1,5 |
A critical distance to put a buffer along the roads has not yet been established. Of all circular structures, 47 (69 %) are situated within a distance of 150 m to the nearest road. Along roads numbered 50 (Herwech 2), 33 and 34, about 80, 87 and 62 % of the circular structures are situated within a distance of 150 m.
A more precise method to deduce the importance of the roads could be reached by calculating for each road the number of circles per distance unit.
4.2 Relation between Bronze Age circular structures and the soilscape
Of the 59 soil units in the study area, only 10 have circular structures (table 2). These 10 units cover 62% of the study area.
The circular structures only appear on sand (Z..) (41%) and silty sand (S..) (21%).
Although the picture for the drainage conditions is more variable, some trends are visible. Their localisation on very dry (.a.) (1%) and dry (.b.) (1%) soils is limited. Moderately dry (.c.) (12%) and especially moderately wet soils (.d.) (41%) are very well represented. Even their presence on wet soils (.e.) (7%) is not to be neglected.
Considering the profile development, soils without profile (..p) (7%), Podzols (..g) (1%), Postpodzols (..h) (39%), Brown Soils (..b) (5%) and soil complexes (..P) (9%) are present.
Table 2: Compilation of data concerning soil units, their surface and the observed and expected number of circular structures
| Soil units | Area | Frequency
of circular structures |
||||
| Texture | Drainage | Profile development | ha | % | Observed | Expected |
| S | E | p | 139,43 | 5 | 1 | 4 |
| S | D | h | 435,01 | 16 | 3 | 11 |
| Z | A | p | 12,88 | 0 | 3 | 0 |
| Z | B | G | 17,20 | 1 | 1 | 0 |
| Z | C | h | 309,01 | 11 | 34 | 8 |
| Z | C | P | 24,30 | 1 | 2 | 1 |
| Z | D | b | 132,27 | 5 | 3 | 3 |
| Z | D | h | 350,20 | 13 | 10 | 9 |
| Z | D | P | 232,71 | 8 | 10 | 6 |
| Z | E | p | 42,42 | 2 | 1 | 1 |
| Total | 1695,42 | 62 | 68 | 43 | ||
The hypothesis that circular structures are equally spread over the area, can be tested by comparing the observed number of circular structures and the expected number of structures (table 2).
- The differences are very high on moderately wet, silty sand Postpodzol (Sdh) units (3 observed versus 11 expected) and on moderately dry sandy soils with a Postpodzol (Zch) (34 observed versus 8 expected).
- The number of circular structures is overrepresented on sandy soils (Z) (64 observed versus 29 expected) and they are underrepresented on silty sand soils (S) (4 observed versus 15 expected).
5. CONCLUSIONS
- A GIS provides a possibility for integrated quantitative analysis of complex interdisciplinary questions. The digital soil map of Belgium can be used as a document for research, as well qualitatively (texture-, drainage-, profile maps, or a combination) as quantitatively (statistics).
- On a macroscale, the textural boundaries do not well coincide with the relief. In the study area, a northwest-southeast textural break line crosses the north-south contour lines. There is no clear relation between the macrotopography and the soil texture, except for the high relief (>15 m), where silty sand is dominant. It should be noticed here that meso- and microrelief studies should be considered when studying the geographical distribution of archaeological structures.
- The overrepresentation of Bronze Age circular structures on the coversand ridge and the range of physiographic parameters in the study area make it difficult to develop a general research strategy based on a critical distance to buffer roads.
- The circular structures are mainly situated on sandy soils. As a hypothesis, we can state that the sandy soils were subjected to degradation due to agricultural practises. Once these soils had lost their agricultural value, they could preferentially be used as funerary areas.
- Old historical roads can be associated with paths that possibly date back to the Bronze Age. Their landscape position is a complex interaction between relief and soils. This shows that historical sources should be introduced more intensively in such interactive studies.
- There is a difference in the pattern and orientation of roads according to the soil texture and the physiographic position. On the coversand ridge (unit A) a capricious pattern prevails while on the silty sand area (unit B) the road pattern is more regular with roads that are oriented parallel as well as perpendicular to the relief units.
6. LITERATURE
Ampe et al., 1995. Cirkels in het Land, Vol. I, 178 pp.
Bourgeois et al., 1998. Cirkels in het Land, Vol. II, 126 pp.
Bourgeois et al., 1999. Cirkels in het Land, Vol. III, 160 pp.
De Vos & Stockman, 1989. Meetjeslandse plaatsnamen van vóór
1600, Deel I: Het ambacht Maldegem, Band I: Adegem, 92 pp.
Fockedey L., 2003. Evolutie van het bodemlandschap en het bodemgebruik in Maldegem-Adegem
(Oost-Vlaanderen): reconstructie aan de hand van historisch-geografische en archeologische
gegevens met behulp van GIS, 103 pp.
Verstraete D., 1949. Oude wegen in het Meetjesland, Appeltjes van het Meetjesland,
nr. 1, pp. 49-57.
Vermeulen F. & Antrop M., 2001. Ancient Lines in the Landscape, 226
pp.